My Quantitative Financial Algorithm
I built an automated algorithm using Quantitative Trading that plays in the stock market and wins!
Three months ago I joined BrainStation, a data science boot camp in Toronto. Part capstone, part personal intrigue, I developed the algorithm knowing it would be a project I could continue to improve on and tweak after graduation.
Less than a year ago I was recommended a book by a friend who works in Private Equity.
Market Wizards: Interviews with Top Traders by Jack D. Schwager
The author, Jack Schwager, interviews a dozen traders that he labels as “wizards”. They might as well be conjuring magic because they all started with relatively nothing and ended up becoming multi-millionaires and renown hedge fund managers. All of them shared a similar story, starting out young and eager to make money, but falling to the pitfalls of trading, because they “Did not know what they were doing.”
The book goes through how these traders went from having nothing to everything, to nothing again, a vicious and draining cycle.
The majority of traders interviewed mentioned the emotional stress of having to deal with volatility, false market signals, listening to bad trading advice from coworkers / friends, and animalistic impulses that are filled with regret.
At a high-level view, this is how I completed my project:
Part 1: Framework Design
Part one consisted of building a skeletal model with the help of Quantopian (A platform for testing financial algorithms using Python coding language) documentation. It was important that I used a homogeneous framework where I could easily iterate over multiple ideas without having to rebuild from scratch. Ensuring the technical infrastructure was robust would allow for a solid foundation, which would provide the impetus for future development.
I constructed my model with a few key design principles in mind. In particular, the model must:
-
Be fully automated with enough freedom to make smart decisions with limited human interaction.
-
Beat the S&P500 growth rate.
-
Be unbiased to market emotions.
-
Embed a portfolio strategy that will always see degrees of success during market fluctuations.
-
Focus on a long-term, medium risk, algorithm that sees exponential growth within 2-4 years.
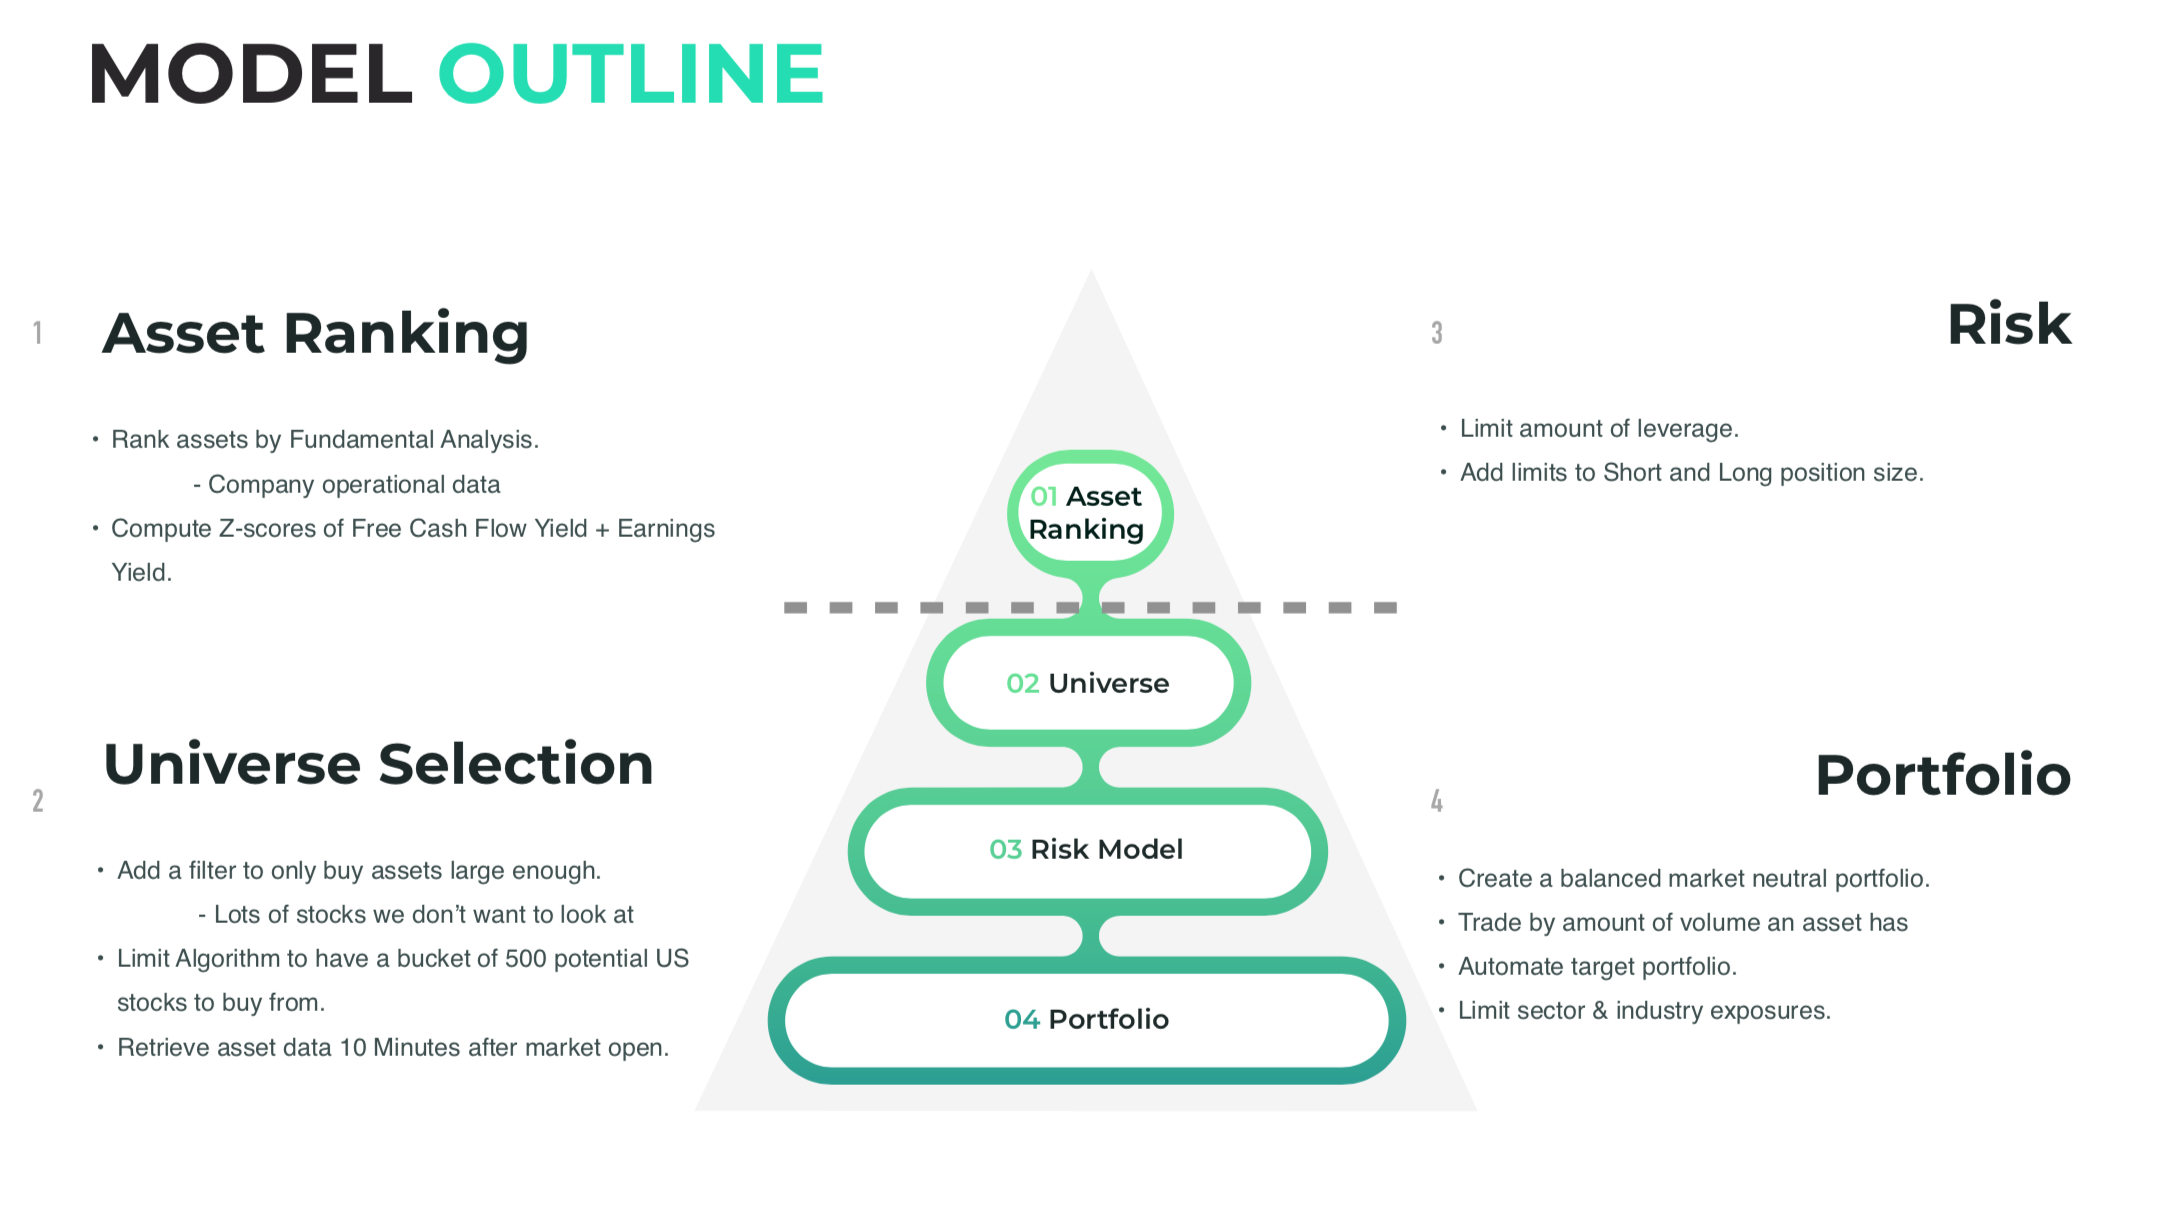
The algorithm is fed stock price via a data pipeline made with Python. To improve model efficiency and speed, I created a filter that produces a result of 500 potential assets in a `bucket’ available for purchase. The bucket, or universe, self-adjusts using daily market data. Interestingly, the universe’s size scales with the model’s effectiveness.
Part 2: Asset Investment Strategy
I don’t have a financial background, so creating a buying and selling strategy took multiple attempts. Ultimately, it played out that my disadvantage turned into an advantage. I did not approach this project as a typical investor who acts on industry knowledge because that involves a bias that may lead to missed opportunities. If you know of the film, “Moneyball”, then you can consider this algorithm as my Moneyball approach to US stock markets… My model will have the complete freedom to choose any sector it wishes to invest in. The most volatile sector throughout testing turned out to be Energy.
While developing my model, I attempted various strategies including sentiment analysis along with short & long moving window averages.
Sentiment analysis is the process of mining text to identify and categorize subject opinion. My model used data from New York Times, Bloomberg, MSNBC, Twitter, and dozens of other financial publications / social media channels to rate assets by public outlook (Sentiment score). A high score translates to positive opinions, which correlates to a growth stock and vice-versa for negative opinions. However, it is not always entirely correct because a social signal doesn’t always justify the potential of a stock.
Using the strategies above, I wasn’t getting an exponential return rate and nor beating the market. I realized that if I wanted to fulfill my key principles, then I would need to have a congruent investment strategy that fits an autonomous model. I moved onto Fundamental Analysis, a more accurate way for my model to make good buy decisions based on asset quality.
Fundamental analysis is the process of assessing the intrinsic value of a security such as a stock or currency, with the aim of discovering whether that security is undervalued or overvalued. The analysis is usually done looking at company fundamentals and ratios on an income statement.
Sentiment analysis and moving averages did not synchronize well with my model. Using fundamentals taken from a company’s income statement, I created a function that ranks assets by a combined free cash flow yield and earnings yield Z-scores, and AVG dollar volume.
In other words, my model would rank assets by a combination of:
-
Company liquidity by Z-score.[Free Cash Flow Yield]
-
If the security is overpriced or underpriced in the market by Z-score. [Earnings yield]
-
How liquid the stock is. [Average Dollar Volume]
A Z-score is the number of standard deviations from the mean a data point is. Given the fact that stocks fluctuate overtime, using Z-scores can help identify more valuable stocks to invest due to comparing stock price with its average.
Company and stock data was pulled from Morningstar and Quantopian API’s and fed through my data pipeline. Check out my Jupyter Notebook for a more in-depth analysis on how I formulated my strategy.
Part 3: Testing and Optimizations.
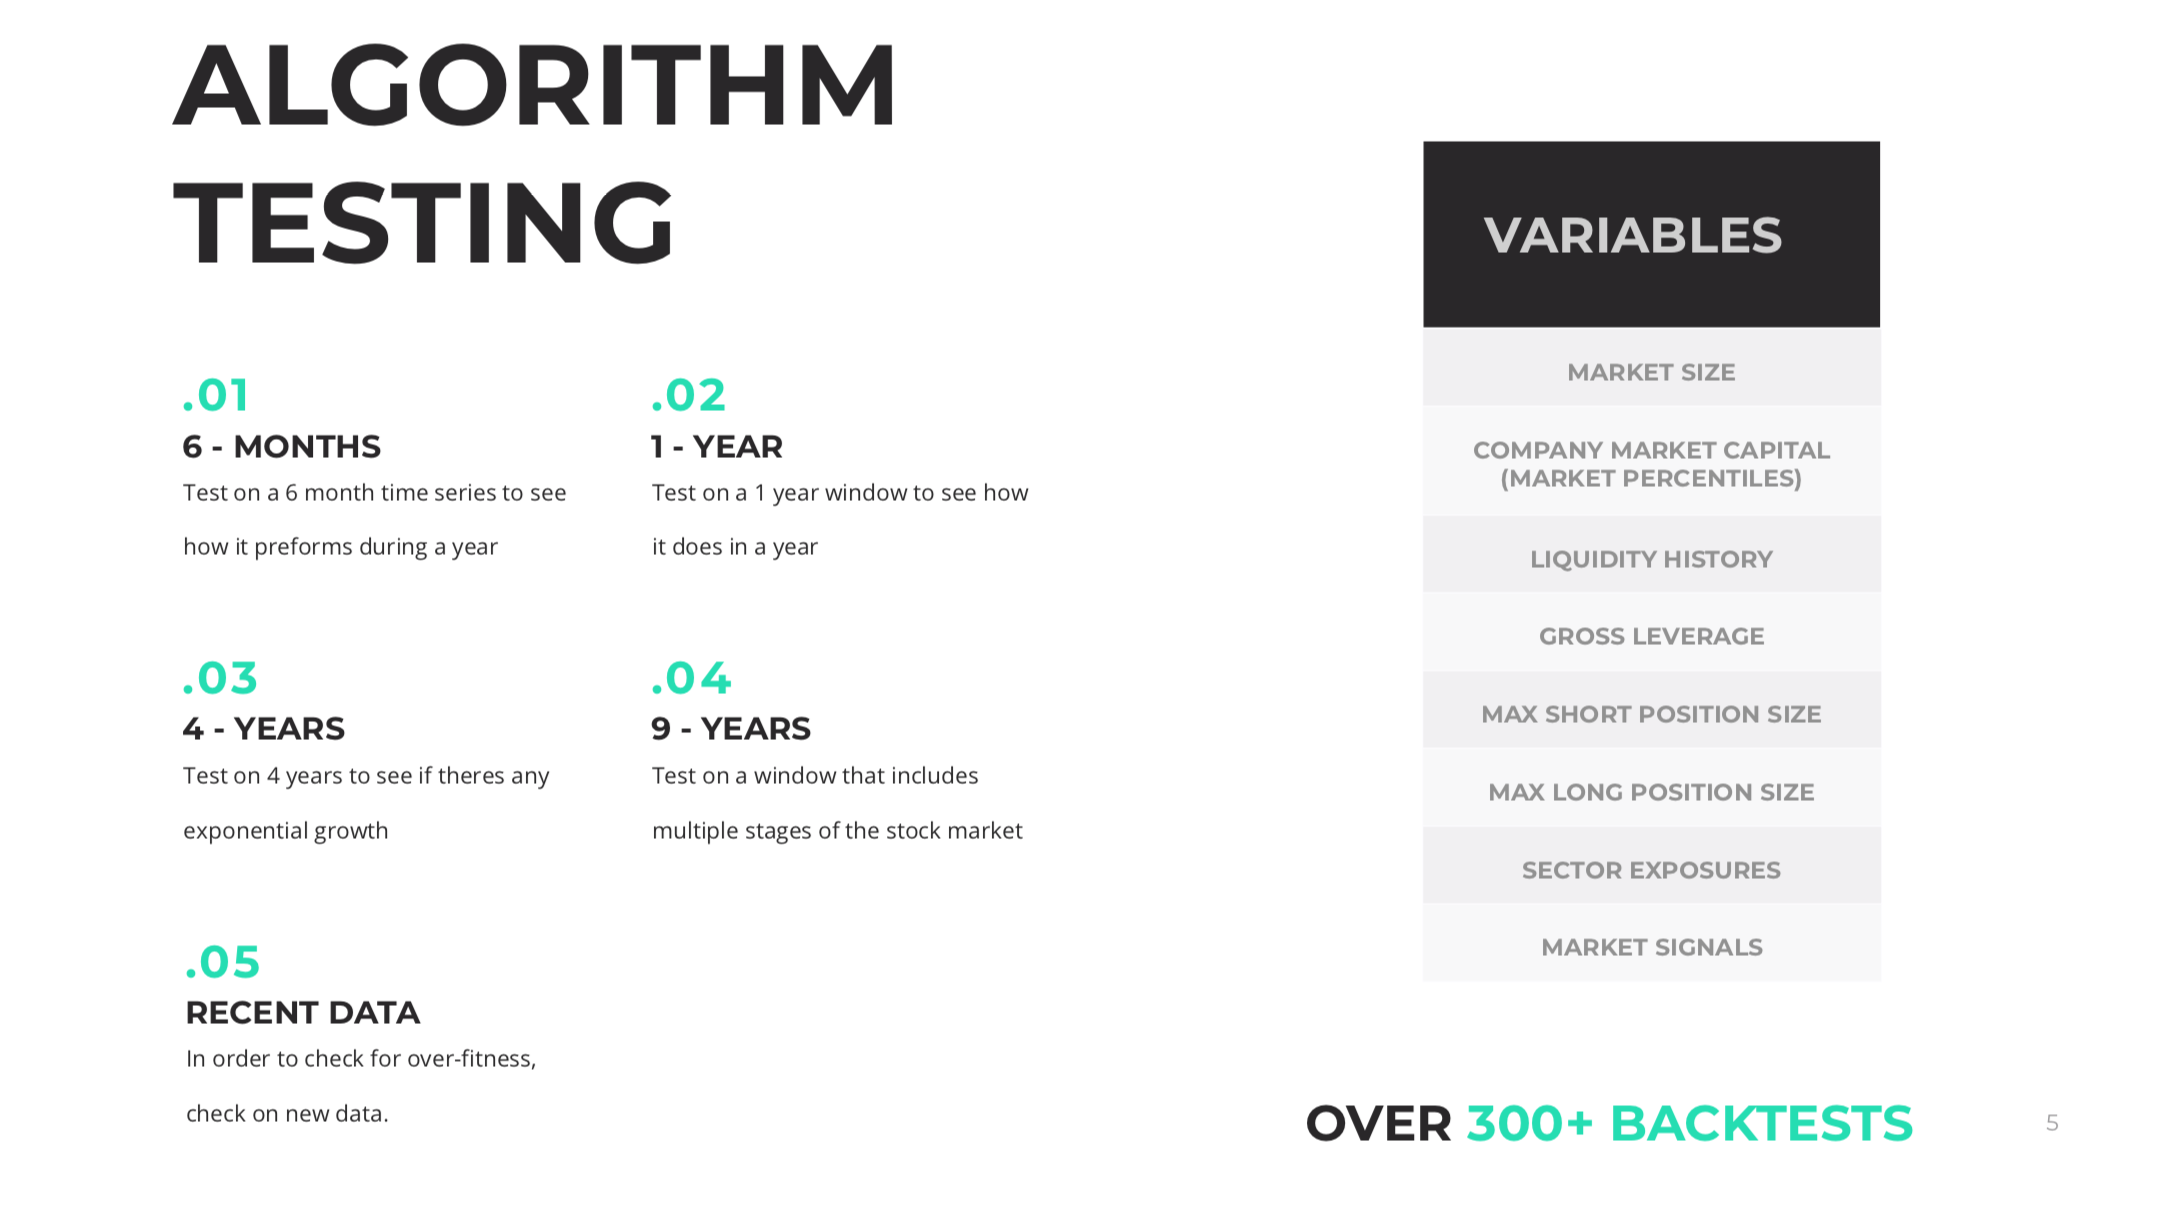
With an initial starting capital of $10,000, I would back test my models on multiple windows of historic stock data. This is to test for over fitness, a problem with financial models. A key aspect for my model is how neutral it will be in the market. For this reason, it was also critical to test on historic data where the markets were bearish and bullish. Ultimately, the goal of my model is to be relatively successful throughout multiple phases of the market.
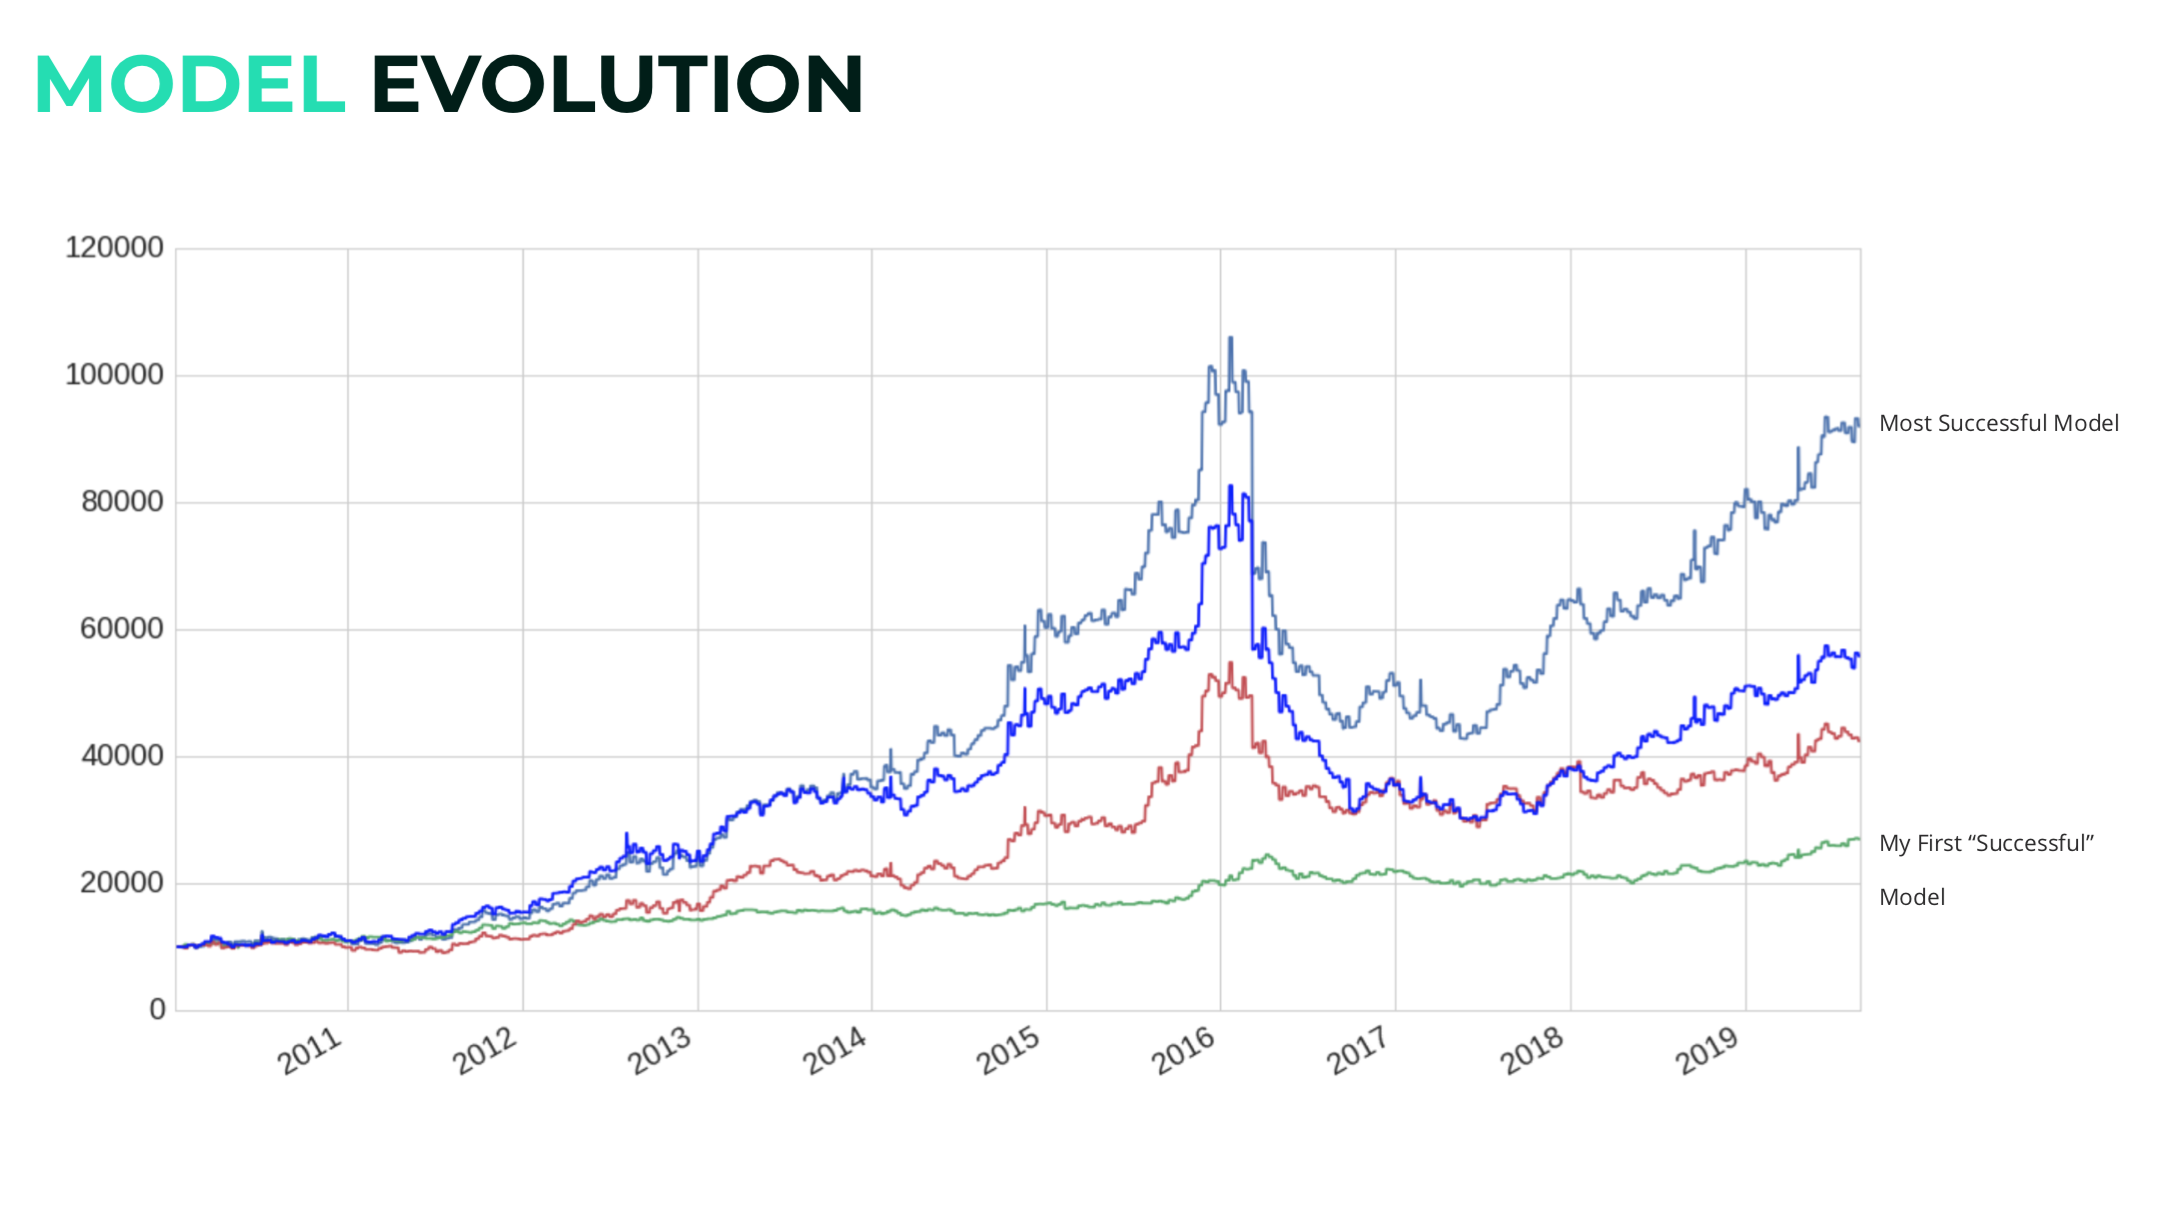
Using Quantopian’s back-testing platform, I rated my algorithms by Alpha, Beta, Sharpe ratio, and cumulative return rate. For each back-test, I would adjust variables (risk + portfolio parameters) to optimize my model and improve it one generation at a time.
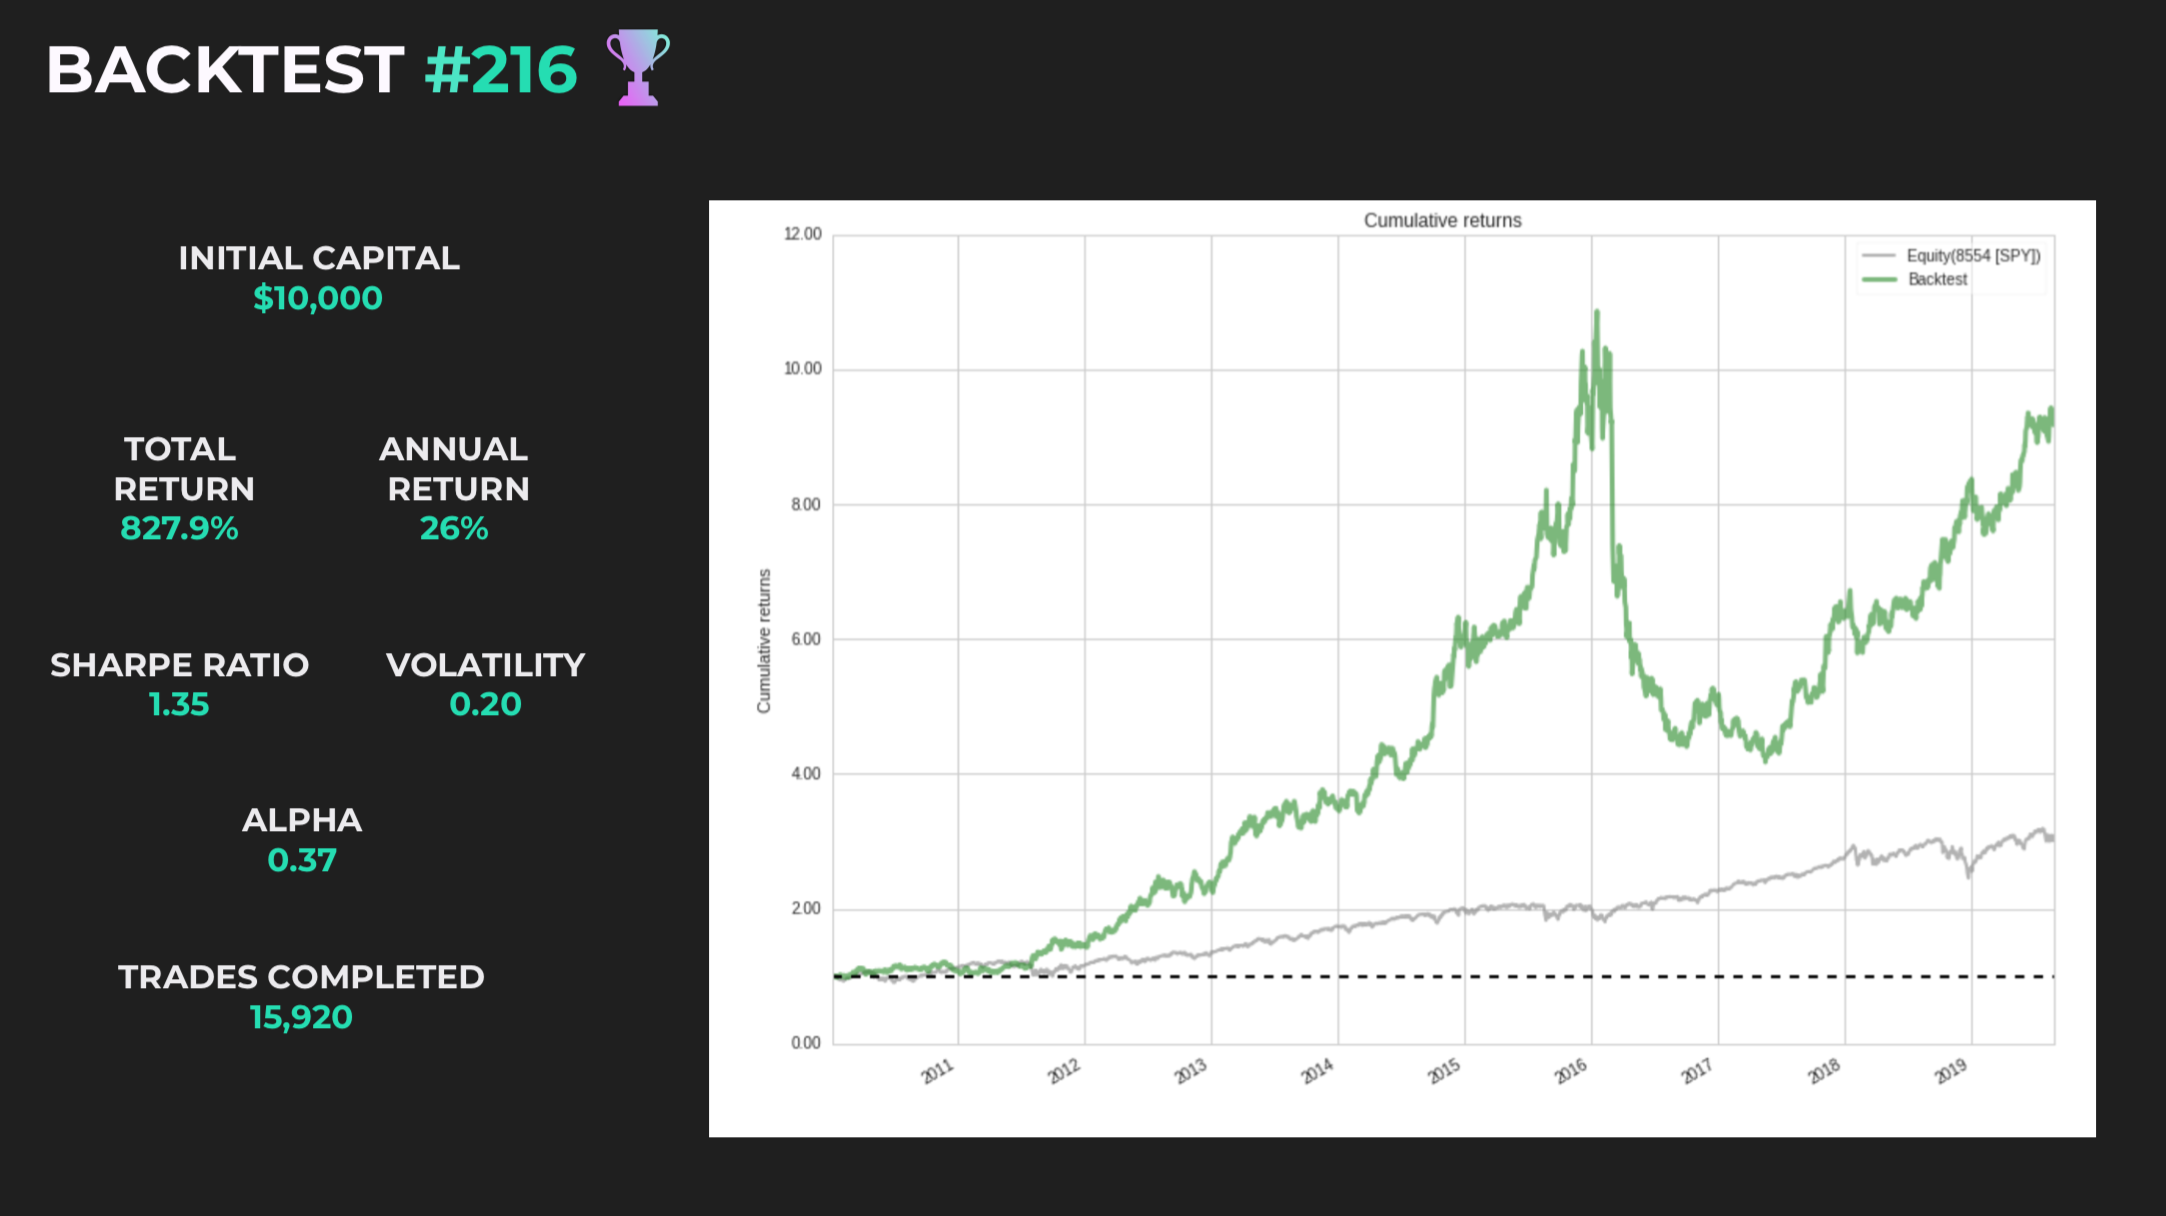
Final Model:
Takeaways:
-
My model had a return rate of 827.9% within 9 years.
-
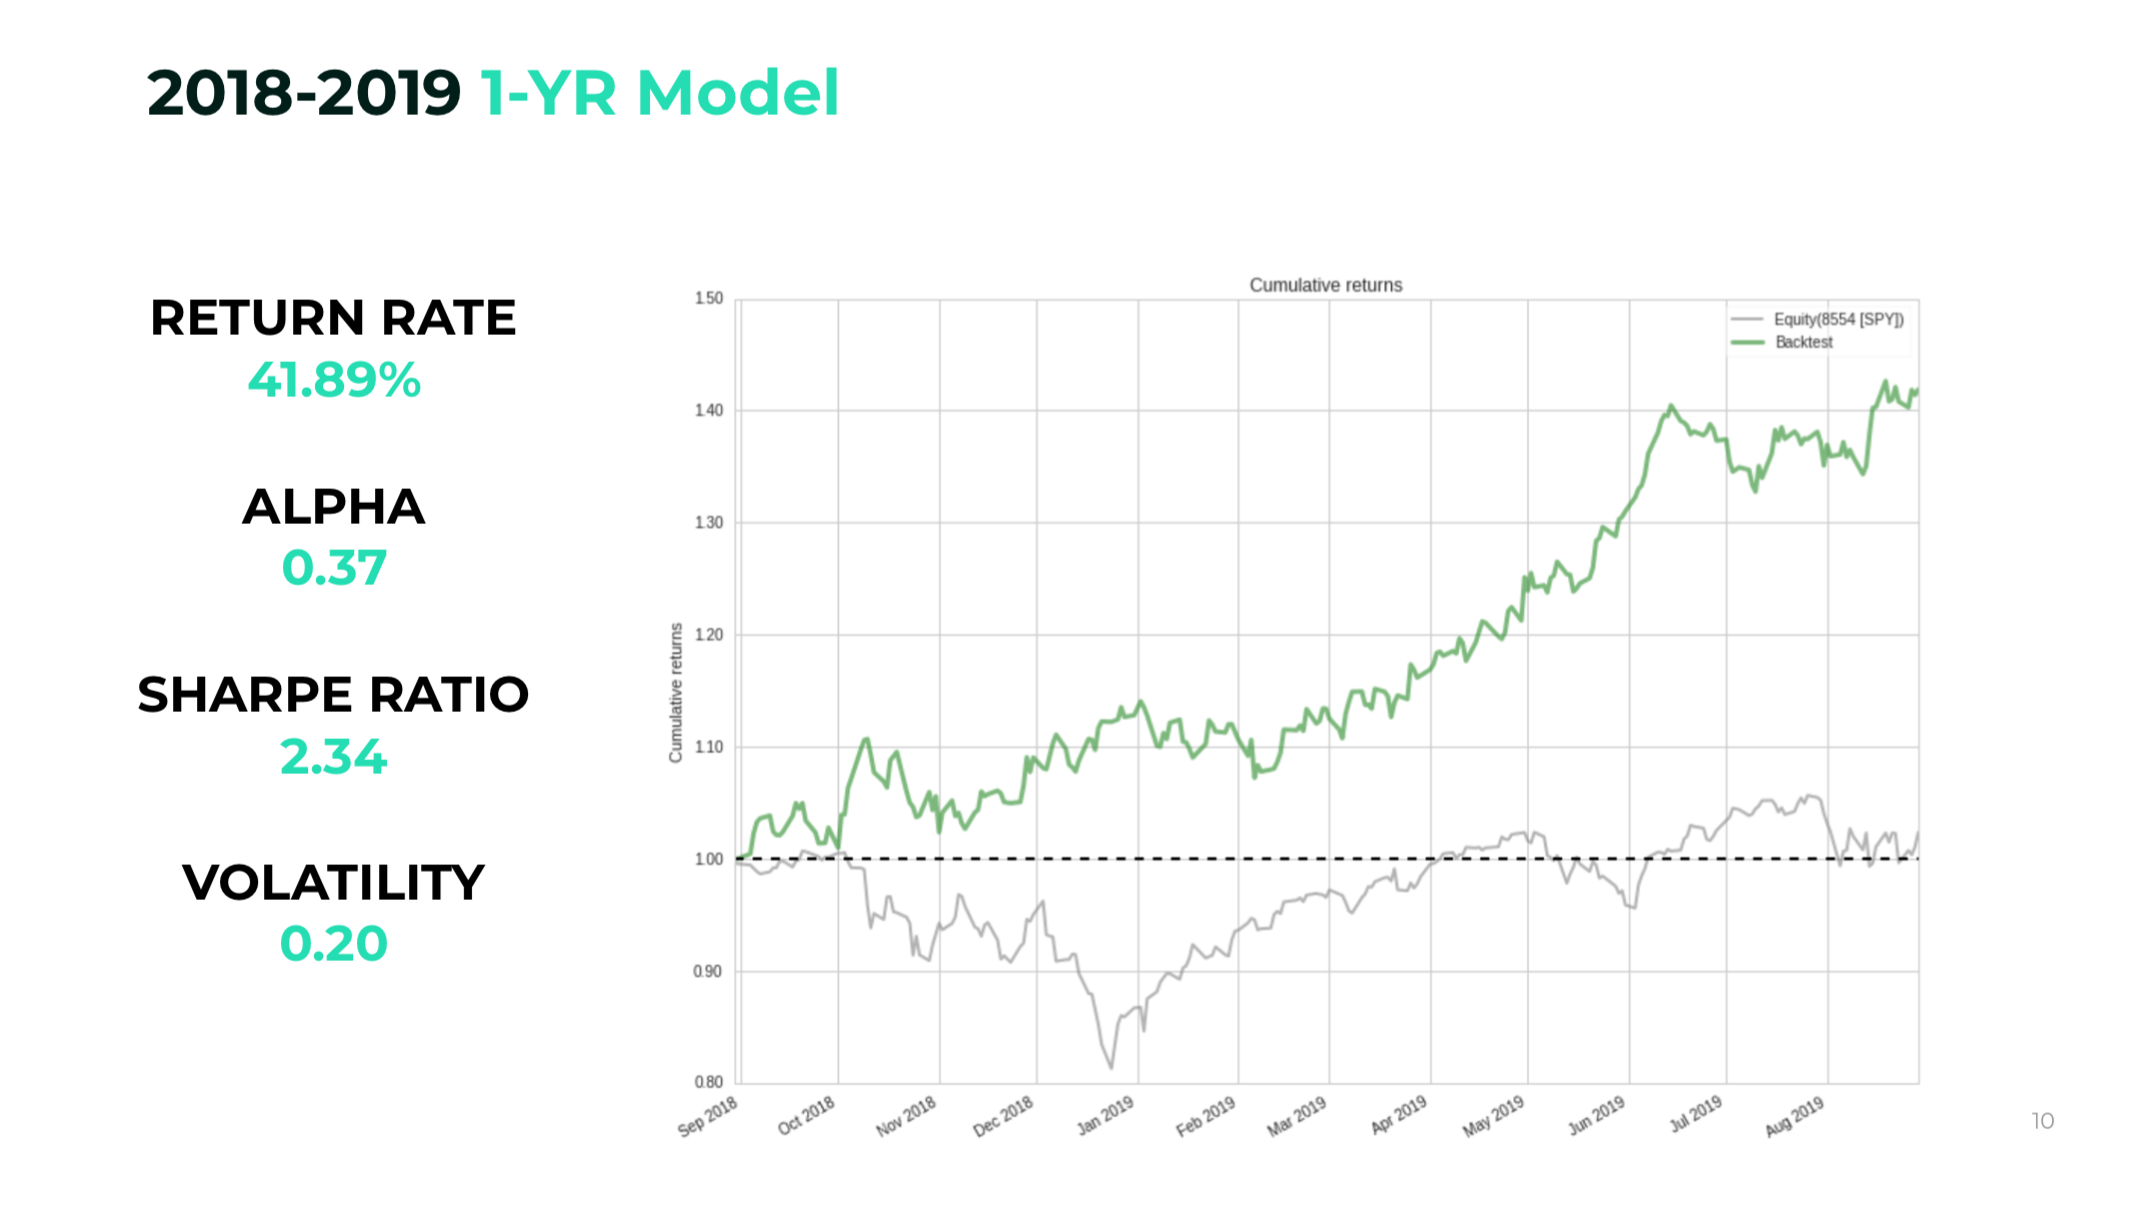
From Sept 2018 - Sept 2019, it managed to get a 41% return rate
-
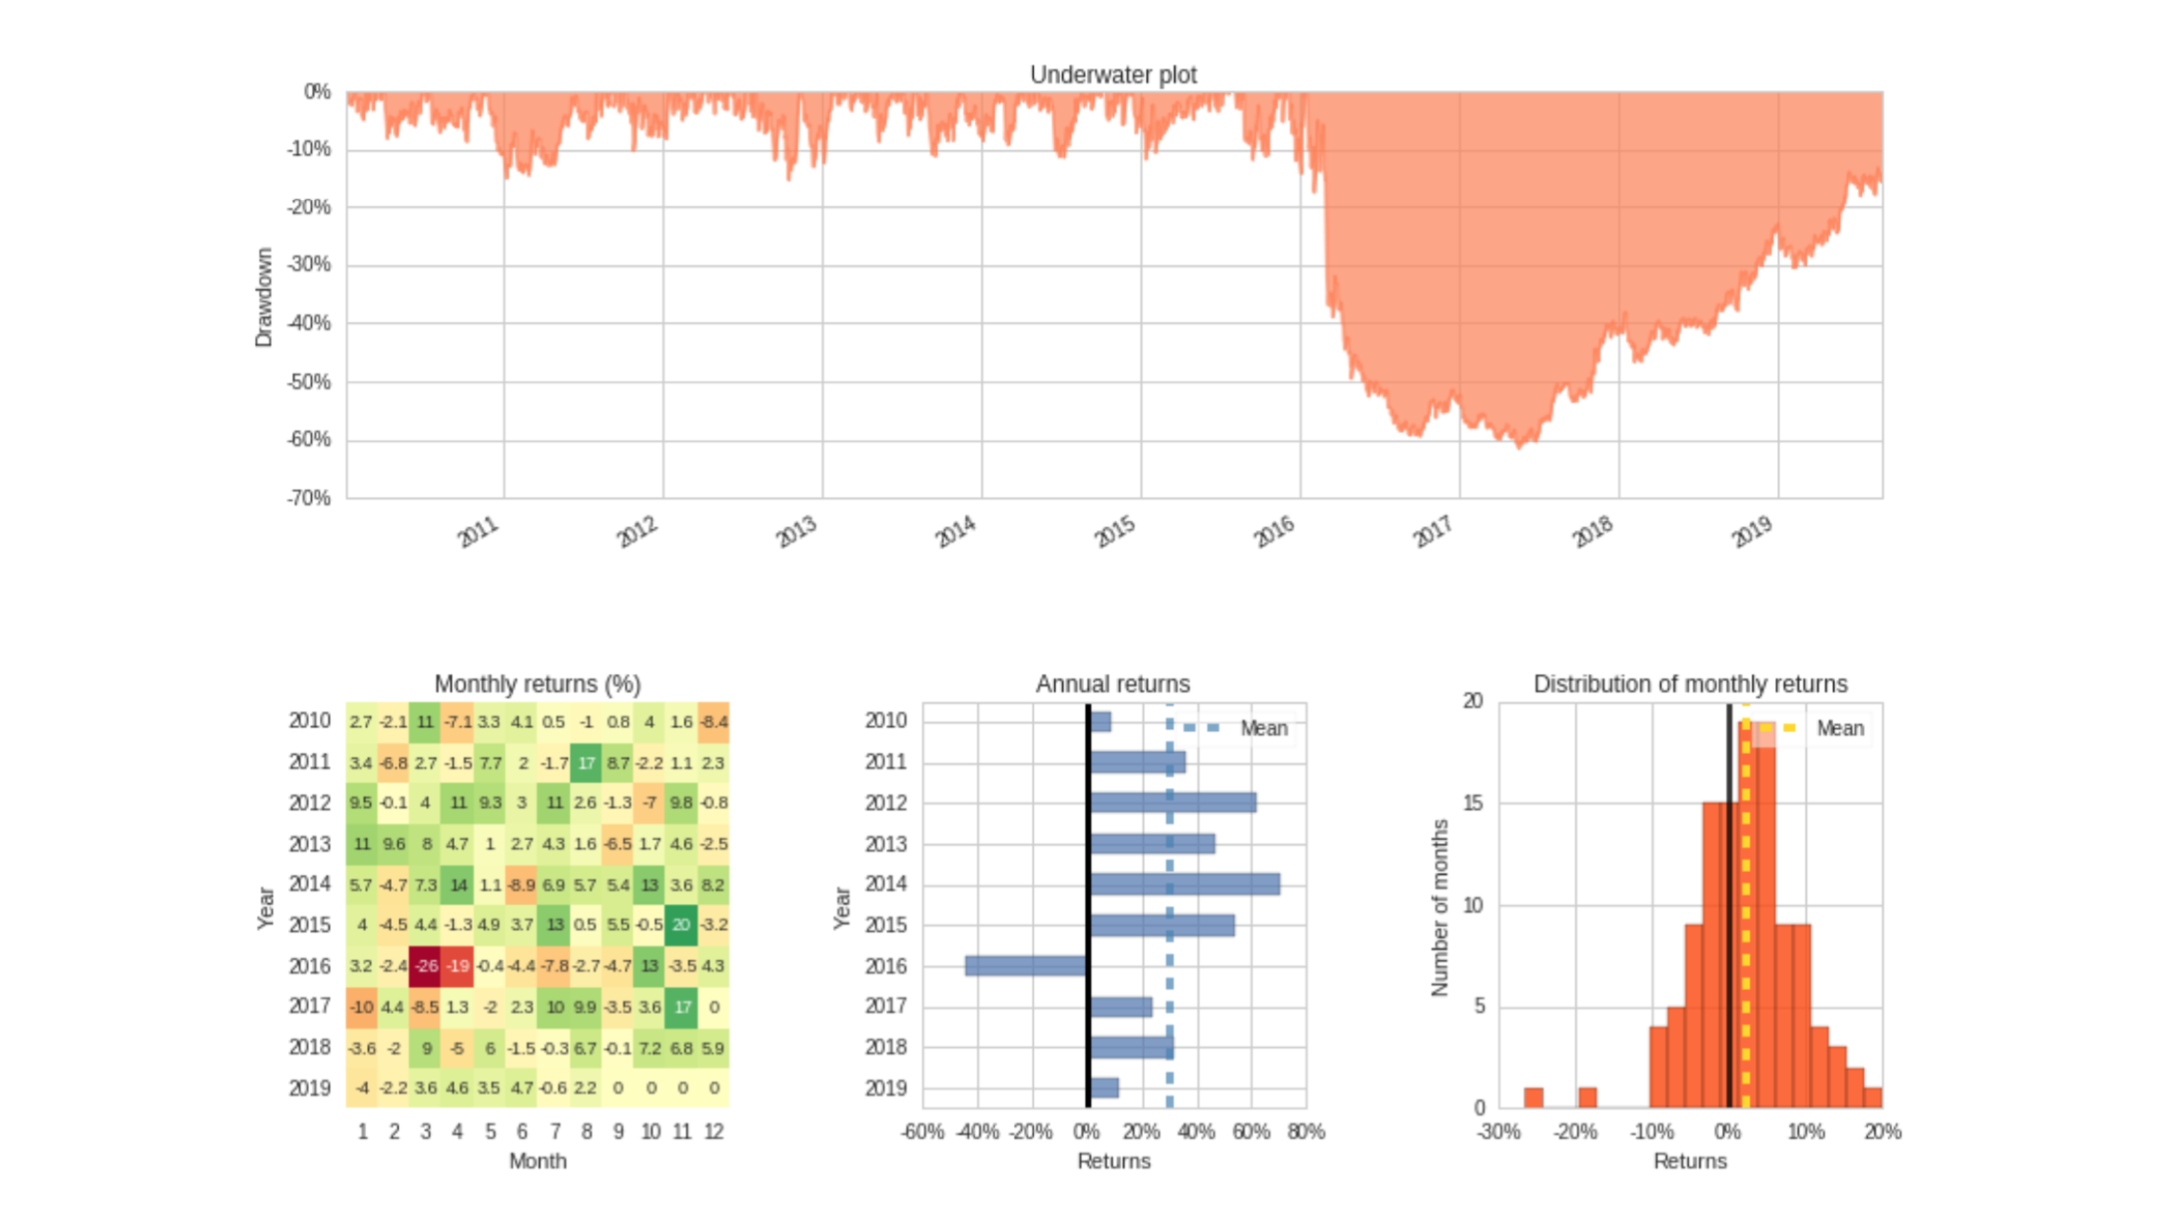
In 6 years it managed to get a over 1000% return before suffering from a market downcycle early 2016.
-
Beating the market with an Alpha of 0.37
Conclusion:
I’m happy with my return rate on historic data, but that doesn’t predict how well my model will perform in the future. However, I am very optimistic that it will perform better than the average trader in efficiency and time-management. Building the algorithm was an exciting process from start to finish with touches of frustrations along the way.
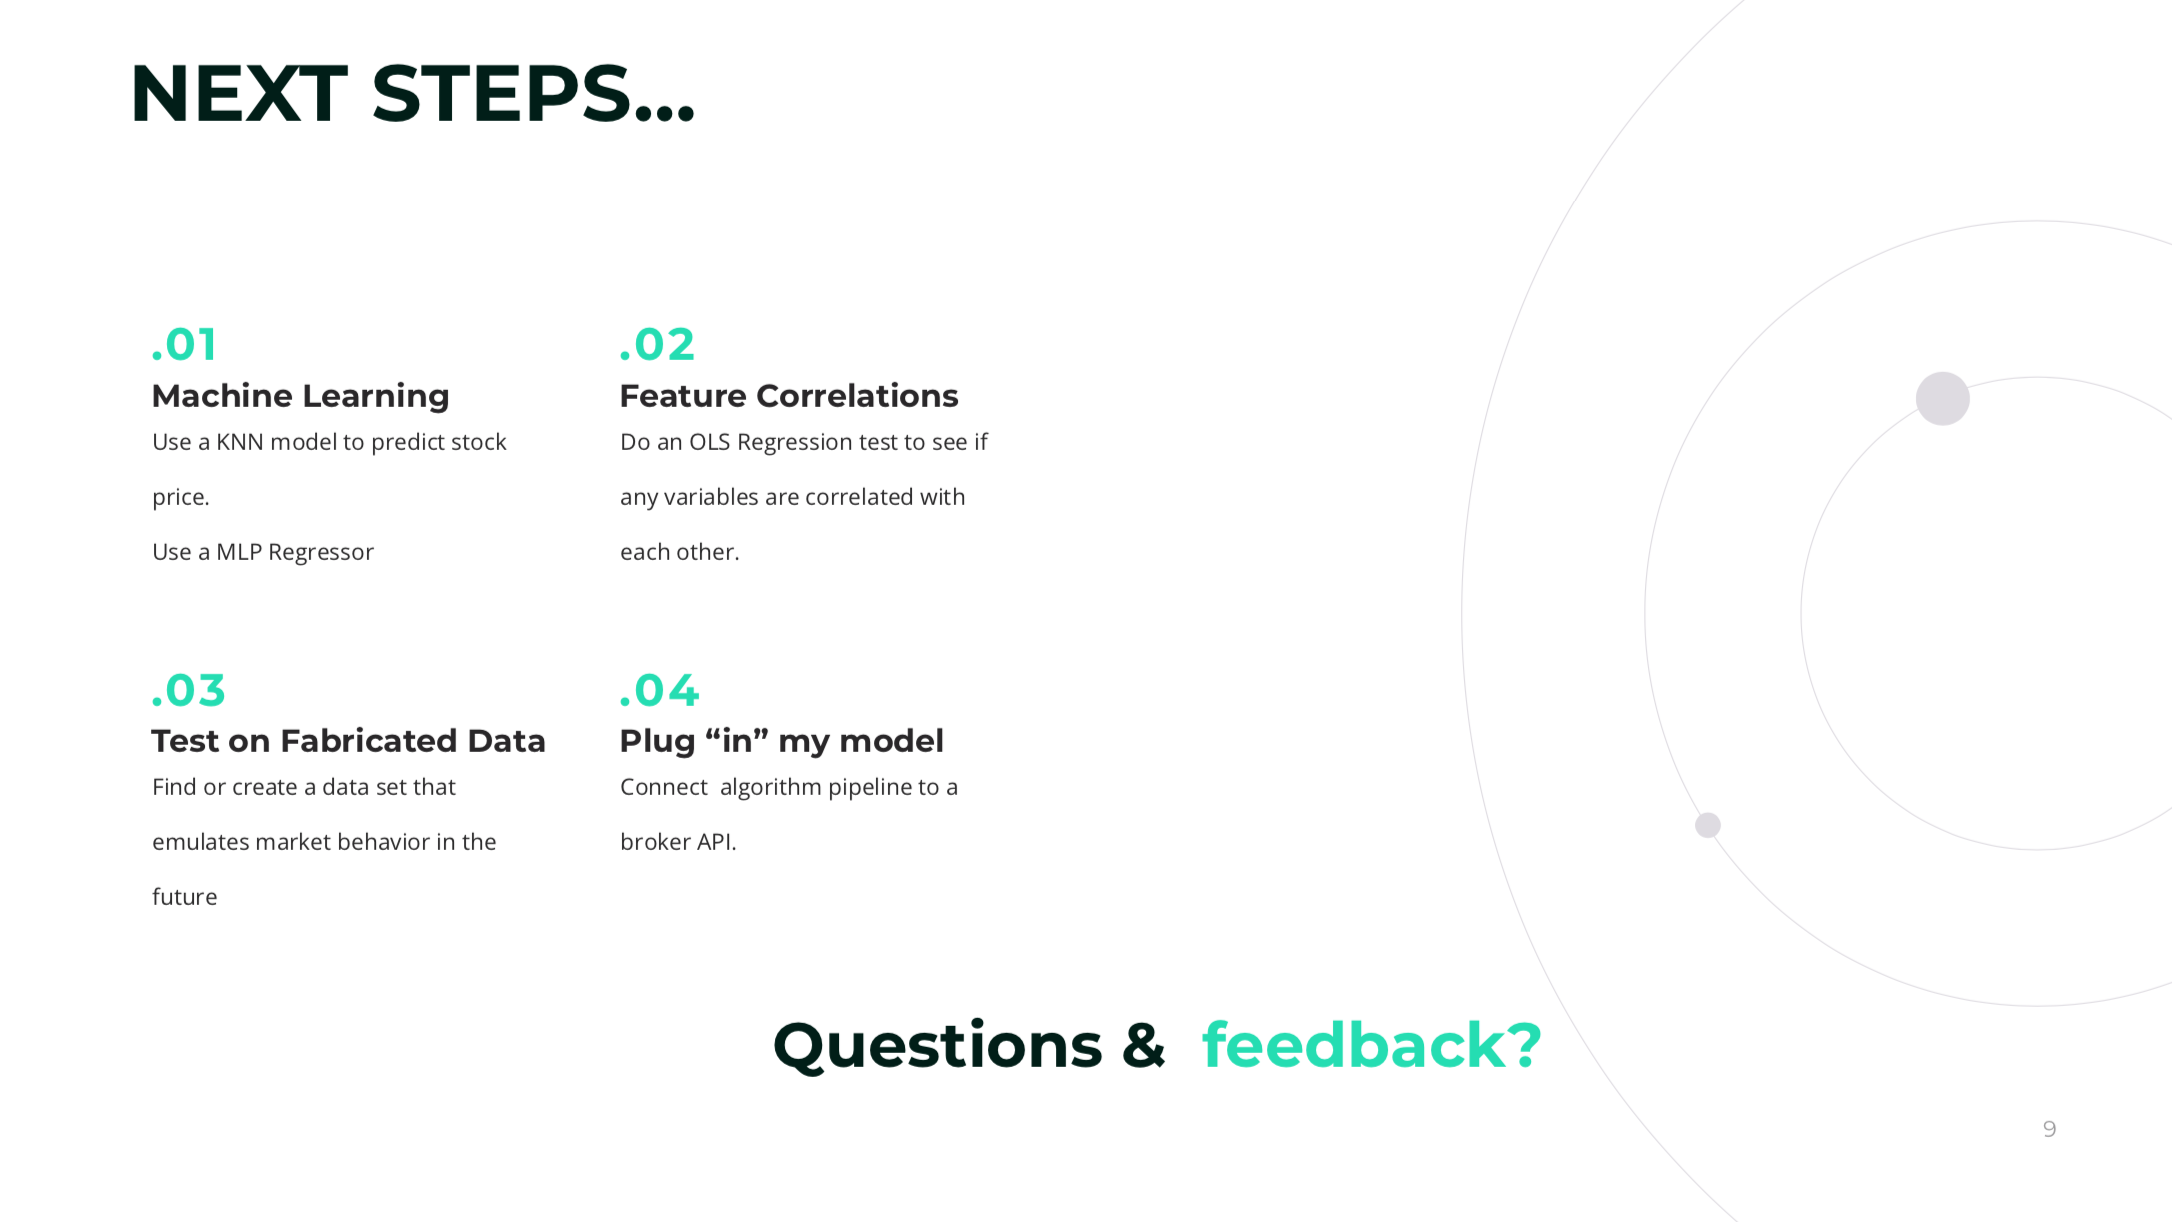
The model is nowhere near perfect and needs more risk control. As for next steps, the model experienced a 60% loss in net returns in 2016. The algorithm borrowed too much money through leverage and purchased large volumes of energy stocks, which tanked around that time. I had to pay off my debts, but no one wanted to purchase those assets, so my model had to eat the losses before it could get rid of them. To prevent something like this happening in the future, I can simply add code to not invest in oil related companies in the future, but still purchase other energy stocks.
Overall, this was a great introduction to Quantitative trading using Python. I credit my success to not knowing anything about trading prior, yes really, and using the mentality of a data scientist when building my model from the ground up. I wouldn’t have been able to complete my model without the help of the wonderful community created by Quantopian, and their well-written documentation about the platform.
I would highly recommend anyone with an interest in learning more about Quantitative trading to start with Quantopian.